Introduction:
Operator’s Footprint in the Market: In this article, we will discuss the concept of an operator and their footprint in the market. We will explore how operators enter the market and how we can identify their presence. Understanding the operator’s footprint is crucial for traders as it can provide valuable insights and help us make better trading decisions.
Table of Contents
Who is an Operator?
An operator is someone who has the power to move the market. They can be high-net-worth individuals, financial institutions, or entities like FII (Foreign Institutional Investors) and DII (Domestic Institutional Investors). These operators have the ability to influence the market and make significant trades.

How Operators Enter the Market:
When an operator enters the market, they leave behind certain footprints or indications that can help us identify their presence. Just like in detective movies, where detectives examine footprints to solve a crime, we can also analyze the operator’s footprint to understand their activities.
Let’s start with an example from the stock market. When an operator enters a stock, they create a certain impact and push the market upwards. By observing the price action, we can try to spot the operator’s entry point. We can also analyze candlestick patterns to gain further clarity on their presence.
Example: Nifty Chart Analysis
Let’s take a look at the Nifty chart to understand how we can identify the operator’s footprint. We will analyze the recent price movement to illustrate this concept.
Between 9:15 AM and 10 AM, there was a significant momentum in the market. The Nifty moved approximately 1000-1500 points during this time. This kind of momentum is not a coincidence or a random event; it is the result of the operator’s actions. By studying the candlesticks, we can get a clearer picture of the operator’s presence.
Read More: Understanding Operators Trap in Stock Market
Operator’s Candlestick Pattern;
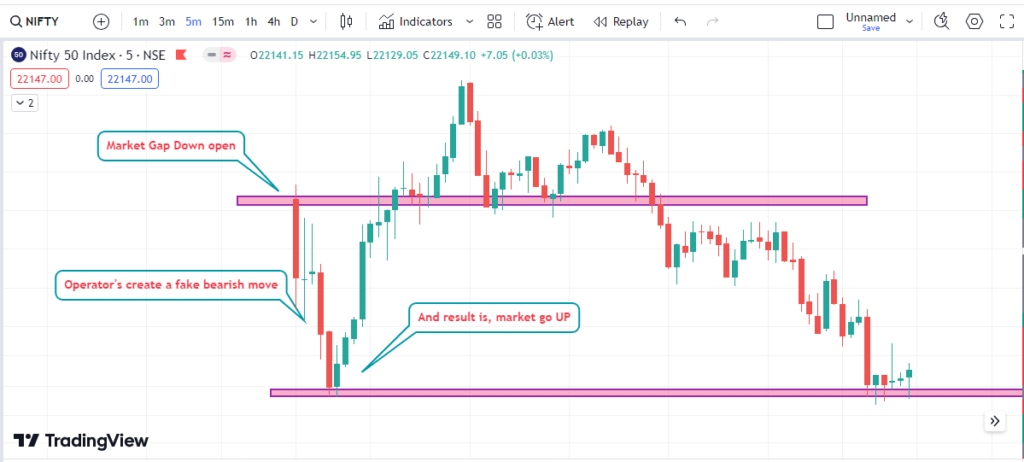
During the momentum, we can observe a specific candlestick pattern that indicates the operator’s activity. The candles initially show a strong bearish movement, indicating the influence of retail traders. However, a small player attempts to create a fake bearish move, followed by a big player who closes the market with a bullish candle.
This kind of candlestick pattern is not something a retail trader can achieve; it requires significant financial power. The operator strategically creates a fearful situation, leading to panic selling among retail traders. In this situation, the retail traders stop loss gets hit, and the market moves in the operator’s favor.
Why is Operator’s Footprint Important?
Understanding the operator’s footprint is essential for several reasons. Firstly, it helps us identify the smart money in the market. By spotting the operator’s entry, we can align ourselves with their trades and potentially profit from their movements. Secondly, it allows us to differentiate between normal market movements and the influence of operators.
Normal price action may be driven by factors like budget announcements, where market participants expect overall bullish sentiments. However, when we observe abnormal movements, characterized by the operator’s involvement, we can expect the market to behave differently. By recognizing the operator’s activities, we can make informed trading decisions.
Read More: How to identify and grow a no trading zone in any chart
Conclusion:
The operator’s footprint in the market can provide valuable insights and help us make better trading decisions. By observing price action and analyzing candlestick patterns, we can identify their presence and align ourselves with their trades. Understanding the operator’s activities can give us an edge in the market and potentially lead to profitable trading opportunities.
People also Ask Question | FAQ:
1. How do you read a market footprint?
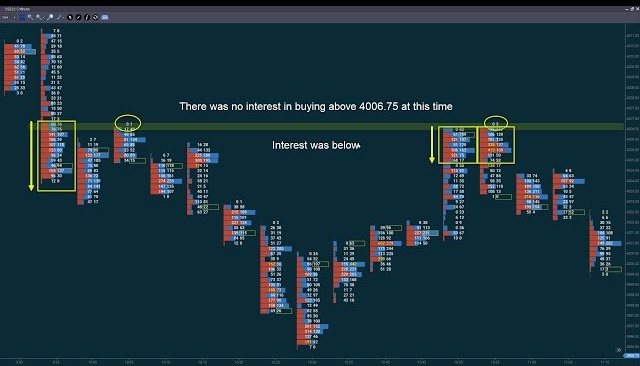
Ans: The number of Market Sell Orders made is on the LHS, while the number of Market Buy Orders made is on the RHS, with the candlestick in between.
2. What is a footprint chart for beginners?
Ans: Footprint is a graphical or table presentation of the very basic and fundamental market data, which are results of trading activity.
3. Are footprint charts useful?
Ans: This gives traders a deeper insight into the market sentiment, the strength of buyers and sellers, and the areas of support and resistance.
4. What is footprint indicator?
Ans: The Footprint indicator allows us to see accumulation and distribution of market volumes.
5. Which broker has footprint chart?
Ans: Market Delta.